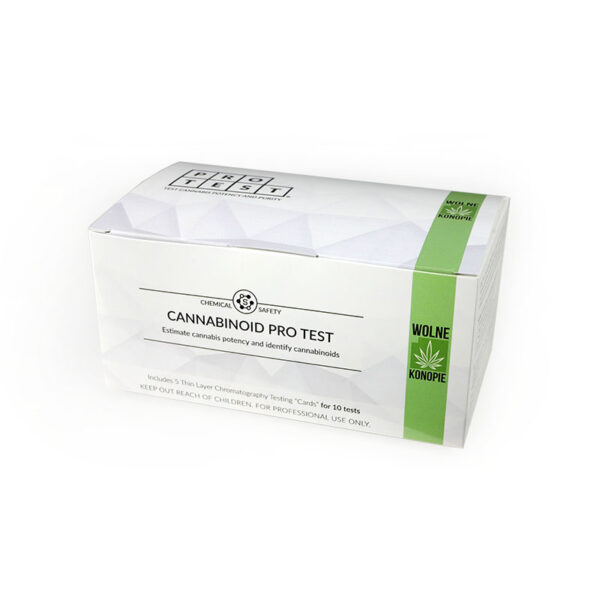
A cannabinoid testing card turns one sample into a column of separate spots, and reading it means knowing which spot is which, how much sample you applied, and what the app does with that. The card handles the separation on its own. What people get wrong is the preparation and the reading, and almost all of it comes down to matching the amount of sample to how strong you expect the sample to be.
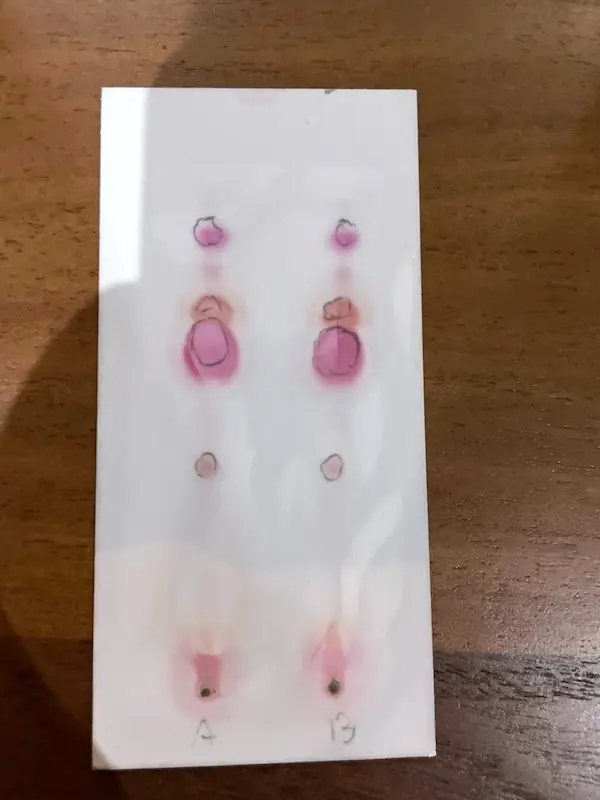
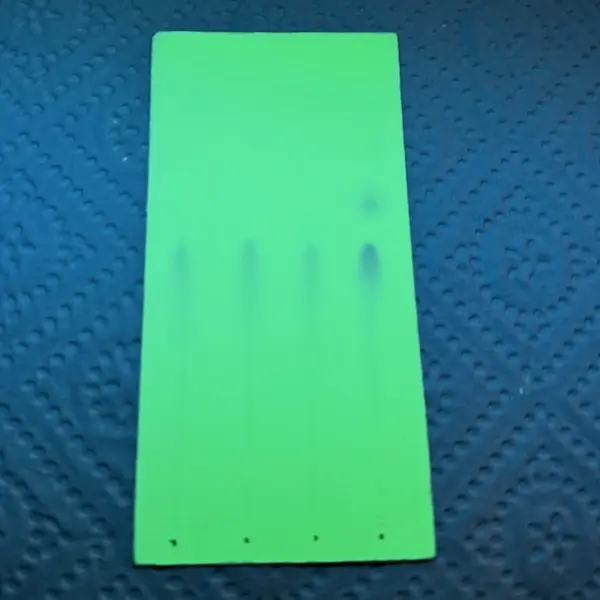
A developed card with two lanes. Each spot is a different cannabinoid, and its height identifies it.
€94,49Original price was: €94,49.€85,01Current price is: €85,01.Add to cart
What appears on a developed card
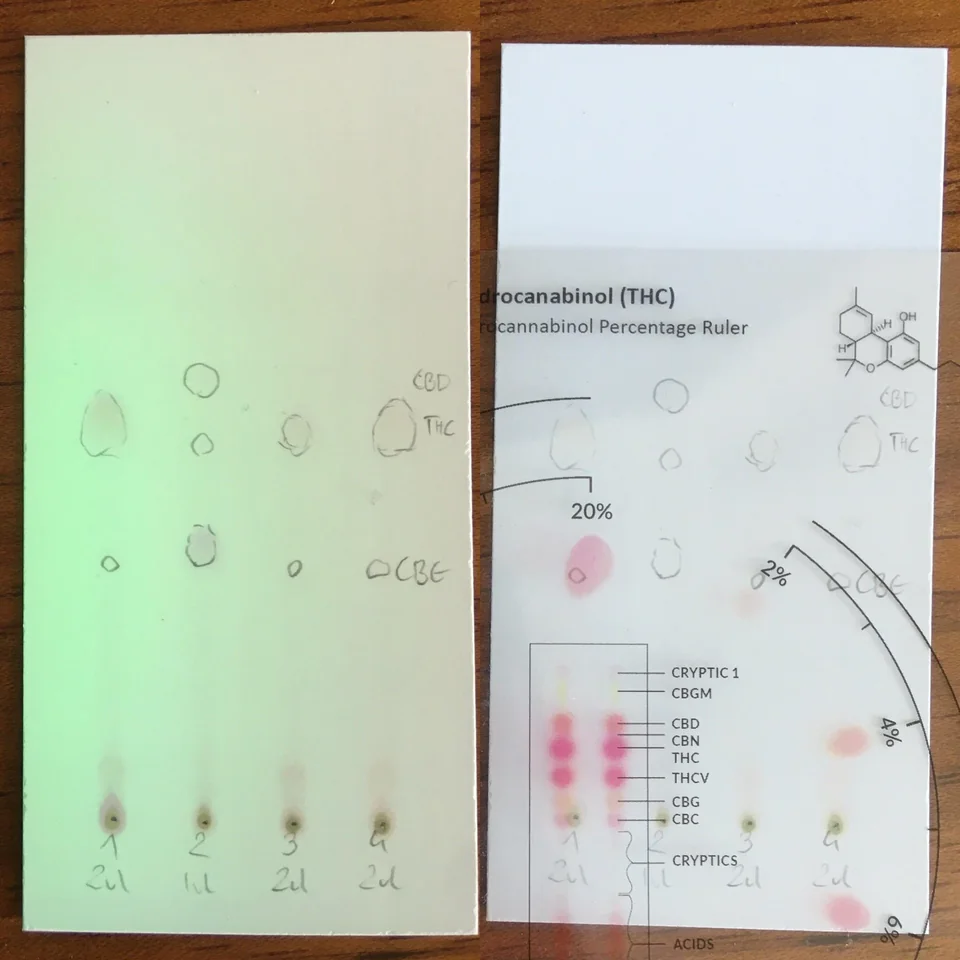
Each cannabinoid travels its own distance up the card. Running down from the top, the bands are CRYPTIC 1, CBGM, CBD, CBN, THC, THCV, CBG and CBC, then a group of minor compounds marked as cryptics, with the acid forms lowest of all. THC sits below CBD, which is the single most useful thing to memorise, because reading the wrong one of that pair is the classic mistake.
Two whole-card patterns are worth recognising before you read any individual spot. A single spot means the sample is one compound. A large flame-like streak along the bottom means the sample was not fully decarboxylated during heating, or it is old and degraded, and the run should be repeated rather than interpreted.
The step that decides your number
The card reads across the full nought to one hundred percent range, and it gets there by changing how much sample you put on rather than by reading a different scale. You choose one of three preparations up front, based on what you expect.
Sample preparation by expected strength, and what to do with the reading
Expected content
Prepare
Apply
Then
Low, 0.2 to 2.5%
200 mg in 1 ml
8 times on one dot
Divide the result by 8
Medium, 2 to 20%
100 mg in 1 ml
2 times on one dot
Read it as it is
High, 20 to 100%
40 mg in 1 ml
Once on one dot
Multiply the result by 5
The high band is for oils and extracts, not for flower or hash. Guessing the wrong band is not fatal: if the spots come out too small, repeat with the next band up, and if they are too large and running together, go down one. If you expect to be at the lower end of a range, doubling the sample is the safer starting point.
Two adjustments matter. Fresh plant material has to be dried for an hour at 110 °C first, and the result then multiplied by 1.25. And to see trace amounts of CBN, THCV, CBG or CBC, apply the sample twice and halve the cannabinoid result.
Reading it: the app, not a ruler
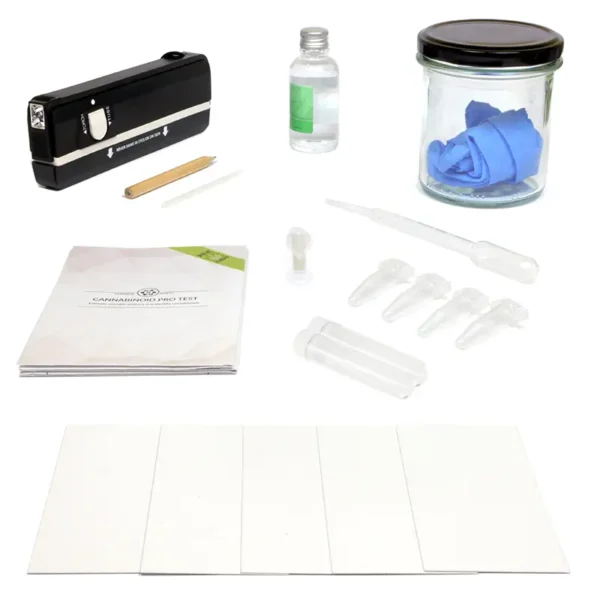
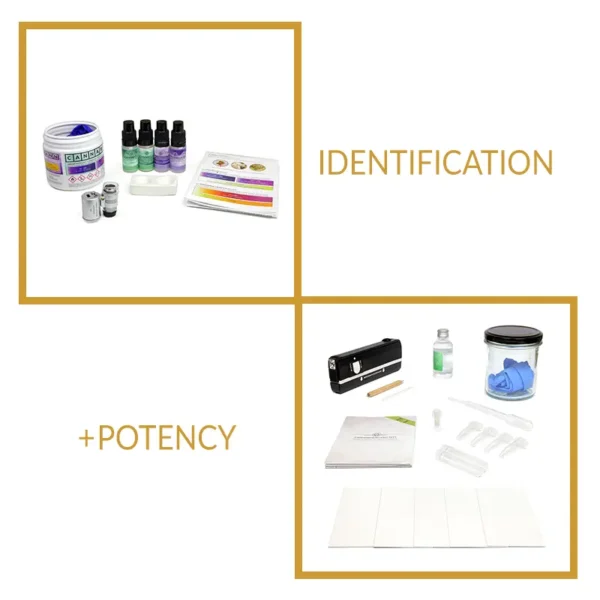
Older kits shipped a plastic percentage ruler. That has been discontinued, and the reading is now done with the DrugsPRO app, which is listed in the kit contents and does the analysis automatically from a photo of your card. It holds the instructions, the reference photos and the videos alongside it, so the comparison step and the method are in the same place.
If you are reading by eye instead, you compare the length of the spot against the printed scale and the conversion chart, not the darkest part of the spot. Circle the whole spot before measuring it. Comet-shaped spots are measured top to bottom, and spot shape varies legitimately, so shape alone is not a fault.
Either way the answer is semi-quantitative: roughly plus or minus ten percentage points on a nought to one hundred scale. That separates a weak sample from a strong one honestly, and it does not pretend to a decimal place. Values between the chart steps are fine to estimate: halfway between two rows is a reasonable fifty percent reading.
The four things that go wrong
Common problems on a cannabinoid testing card
Problem
What you see
Fix
Wrong preparation band
Spots far too large and merged, or too faint to measure
Repeat one band up or down
Not decarboxylated
Large flame-like streak along the bottom
Re-run, heating the card properly first
Reading the wrong band
A confident number taken off CBD
THC sits below CBD; match against the reference
Contamination
Big dark patch across the top of the card
Handle cards by the top edge only, clean the jar
An oversaturated card, here from a cocaine sample. Too much material and the spots stop being separate. The same failure happens on cannabinoids.
What a clean card does not settle
A good profile tells you what cannabinoids are present and roughly how much. It does not cover pesticides, moulds, heavy metals or residual solvents; no home method does, and that is a laboratory question. The card does not cover it.
It also does not show a synthetic cannabinoid directly, because those are not cannabinoids and do not behave like them on a card. What it does show is the absence that gives them away: a sample you expect to be psychoactive that contains only a trace of THC. That is the most reliable home indication there is, and it is covered in how to detect synthetic cannabinoids.
For presence on one sample, the first link below. For the profile and the percentage, the second, and the third if you want identification alongside it.
Cannabinoid testing cards: how to read the result: common questions
How accurate is the percentage?
Semi-quantitative, within roughly ten percentage points on a nought to one hundred scale. Enough to tell a weak sample from a strong one, not enough to quote to a decimal place.
My card is one big smear.
Too much sample for the band you used. Repeat with the next band down: less material, or fewer applications on the dot.
Why is there a streak along the bottom?
Usually incomplete decarboxylation, meaning the card was not heated properly before developing. It can also mean the sample is old and degraded. Either way, re-run it.
Do I still need the plastic ruler?
No. It has been discontinued and the DrugsPRO app does the analysis from a photo. Reading against the printed scale and chart by eye still works if you prefer.
Can one card read hash, flower and oil?
Yes, with the right preparation for each. Oil belongs in the high band, flower and hash in the medium one, and hash needs less starting material than flower because it is far more concentrated.
No test result can tell you a substance is safe. No substance is 100% safe.This article is published for harm reduction purposes. It does not encourage the use of psychoactive substances and does not replace medical advice.